Introduction to PIXet Basic Software
Collecting Data
- Connect the MiniPIX EDU camera and launch the software PixetBasic (fig. 1).
Figure 1. The interface of the PIXet Basic - The settings supposed to be modified while performing the experiments are shown in figure 2.
Figure 2. The two arrows show the only place to modify the settings - The collected visual data will be displayed on the black screen and the additional data (counts, histograms, etc.) is displayed in the two sections- Image Info and Spectra as shown in figure 3.
Figure 3. The data of the experiment will be displayed in the two sections
- The image info shows energy in the “Info” tab and counts of individual particles in the “Tracks” tab.
- The spectra section shows the energy, size, and time of individual particles in respective tabs.
NOTE: To enlarge the spectra results, click on the rectangle at the top right corner of the spectra window.


Exporting Data
- Select the energy graph in spectra and right-click on the histogram in the spectra section and click on Save to File as shown in figure 4.
Figure 4. The histogram of collected data is being exported as ASCII - Enter the file name and select ASCII Vertical in Save as type drop-down menu. Click on Save as shown in figure 5.
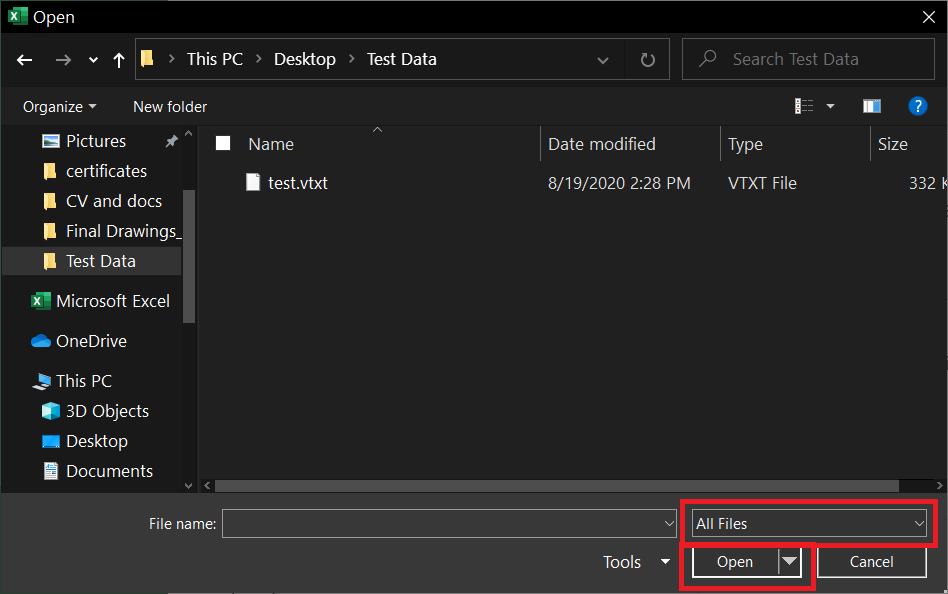
Figure 5. The type of file in the save window should be vertical to make sure that we get the whole histogram - Next open Excel. Click on Open > Browse and browse to the saved file. Select All Files from the drop-down menu next to the File name field, select the file and click open as shown in figure 6.
Figure 6. The Open window of excel showing the “vtxt” file - Select Delimited in the Text Import Wizard window and click on Finish as shown in figure 7.
Figure 7. Excel delimiting the data to sort it in different columns - The first two columns of sheet are the list of the energy of alpha particles, the next two columns are for electrons, the next two are muons and the last two are dots.
- Now select the first two columns and click on the Insert menu. In the Charts section, click on the Scatter chart and select Scatter with Straight Lines to get the histogram.